Read Time:3 Minute, 26 Second
The Precision of Gaze Analysis
Gaze analysis provides fascinating insights into where people focus their attention. In one of my projects, I used DBSCAN (Density-Based Spatial Clustering of Applications with Noise) to identify dense regions of gaze points, calculate their centroids, and measure how far these centroids were from predefined target points. This approach enabled me to quantify how accurately participants’ gazes aligned with target points.
Let’s dive into the methodology!
The Problem: Finding Focus and Measuring Accuracy
During the Random Saccade Task (RAN) experiment, gaze data was collected for each target point. However, individual gaze points often exhibited variability around the target, forming dense clusters instead of perfect alignments.
To evaluate accuracy and consistency, I needed to:
- Identify clusters of dense gaze points around each target.
- Calculate the centroid of these clusters (representing the most focused point).
- Measure the distance between the centroid and the target point.
The Methodology: Step by step
Step 1: Apply DBSCAN to identify Dense Clusters
DBSCAN is ideal for clustering spatial data because it group points based on density, while ignoring noise or outliers. Here’s how I used it:
					from sklearn.cluster import DBSCAN
import numpy as np

# Simulate gaze data for a single target point
np.random.seed(42)
target_point = np.array([5, 5])
gaze_points = target_point + np.random.normal(0, 1, size=(1000, 2))  # Gaze points around the target

# Apply DBSCAN
dbscan = DBSCAN(eps=0.5, min_samples=10)
labels = dbscan.fit_predict(gaze_points)

# Extract clustered points
clustered_points = gaze_points[labels != -1]  # Exclude noise (-1 label)
Step 2: Calculate the Centroid of Dense Clusters
Once DBSCAN identified dense clusters, I computed the centroid of the largest cluster. This centroid served as the most focus point for the participant.
					from scipy.spatial.distance import cdist

# Find the largest cluster
unique_labels, counts = np.unique(labels[labels != -1], return_counts=True)
largest_cluster_label = unique_labels[np.argmax(counts)]

# Filter points belonging to the largest cluster
largest_cluster = gaze_points[labels == largest_cluster_label]

# Calculate the centroid
centroid = np.mean(largest_cluster, axis=0)
Step 3: Measure the Distance to the Target point
FInally, I calculated the Euclidean distance between the cluster centroid and the target point, quantifying how closely the gaze was focused on the intended target.
					# Calculate Euclidean distance to target point
distance_to_target = np.linalg.norm(centroid - target_point)

print(f"Centroid: {centroid}, Target: {target_point}, Distance: {distance_to_target}")
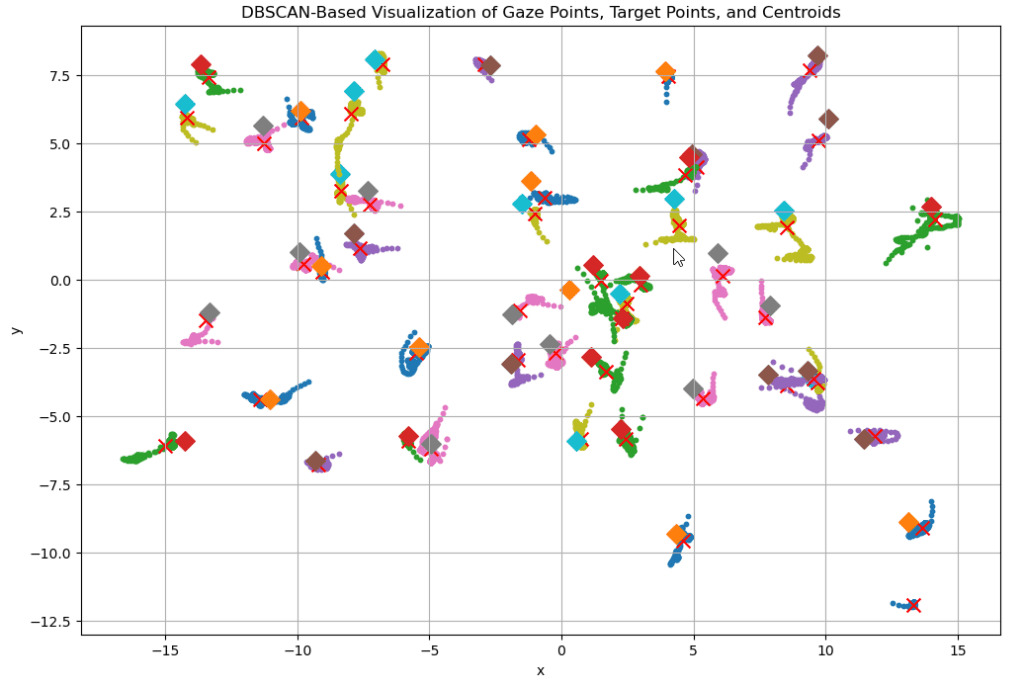
Visualize the Results
To make the analysis more intuitive, I plotted the gaze points, and the centroid alongside the target point.
Key Takeaways
- DBSCAN Effectively Handles Noise: DBSCAN focuses on meaningful clusters by filtering out outliers, making it ideal for gaze data where some points may deviate due to participant variability or tracking errors.
- Centroid Represent Focus: The centroid of the largest cluster robustly represents the participant’s primary focus.
- Quantifying Accuracy: Measuring the distance from the centroid to the target point provides a clear metric for evaluating gaze accuracy.
Challenges and Potential Improvements
- Tuning DBSCAN Parameters: the choice of
eps (neighborhood radius) andmin_samples significantly impacts the clustering result. I tuned these based on the spatial distribution of gaze points. - Multiple Clusters: in cases where multiple clusters formed, I focused on the most prominent cluster but acknowledged that gaze might shift across regions.
- Temporal Cata: Incorporating time stamps could reveal how gaze patterns evolve, adding a dynamic layer to the analysis.
Conclusion: Where We Look and How Closely We Focus
Using DBSCAN to analyze gaze density helped me uncover meaningful clusters in the data and measure how accurately participants’ gazes aligned with target points. This method bridges the gap between raw gaze data and actionable insights, providing a clear metric for focus and accuracy.\
Whether for user experience studies, psychological research, or beyond, this approach highlights the power of combining clustering algorithms with spatial data to make sense of where and how well people focus their attention.